
The urgency of climate change is more evident than ever, as emphasised by the 2021 Intergovernmental Panel on Climate Change (IPCC) report. Travel & Tourism is strongly affected by its impacts, but as many other sectors, is also an important emitter of greenhouse gas (GHG) emissions, thereby actively contributing to climate change. It is therefore of utmost importance to decarbonise the sector as quickly as possible and reach net zero by 2050.
Travel & Tourism Industries In Focus
While there is more data and reporting insights available on carbon emissions for aviation, accommodation, and cruise, there is a lack of valid estimates for tour operators, OTAs, TAs and the other types of intermediaries at an aggregated level. Hence, for the purpose of this report, the industry breakdowns estimated by Lenzen (2018) were used as the basis for the assessment of pre-pandemic carbon emissions for Travel & Tourism industries as well as some of the most significant contributing industries in the Travel & Tourism value chain (see Exhibit 3 and 4)
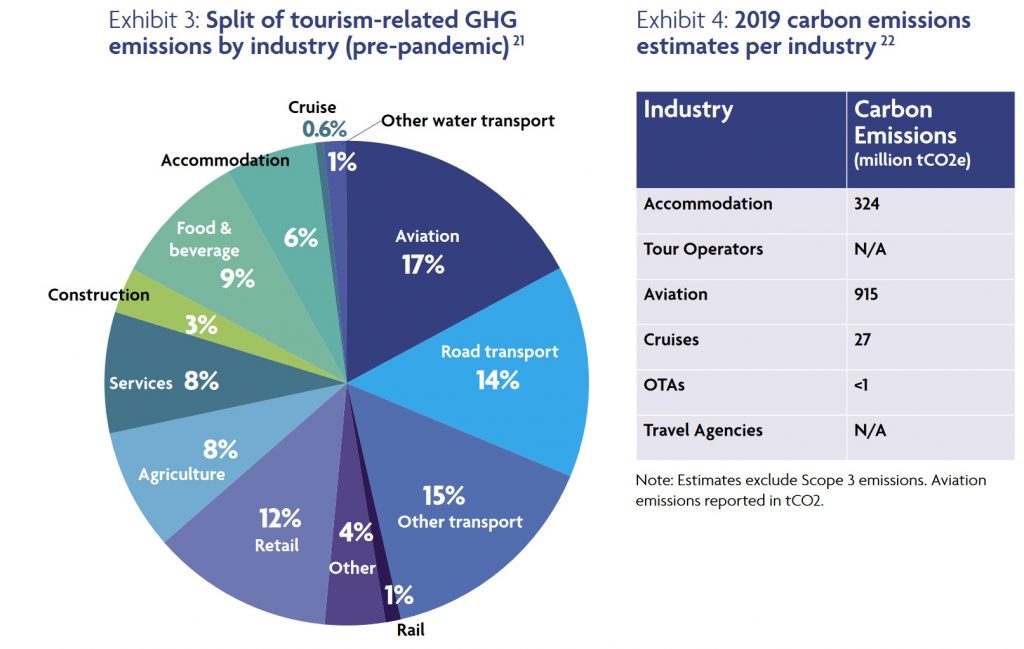
Note: The above emission share has been updated for aviation by using the latest IATA’s Aviation and Climate Change Fact Sheet pre-pandemic estimates. Cruise was separated from water transport by conducting a bottom-up estimation based on sustainability reports. The chart includes shares of most contributing scope 3 emission sources (e.g. agriculture).
The 6% contribution of accommodation to the total Travel & Tourism emissions of 5.4b tCO2e translates to 324 million tonnes of CO2e. Other industries in the accommodation value chain such as food & beverages are explicitly separated suggesting that the previous 2008 accommodation estimate of around 21%23 included Scope 3 emissions. The cruise industry accounts for approximately 0.6% of total Travel & Tourism emissions, representing an estimated 27 million tCO2 on the basis of the consolidation of carbon emissions reported by the top four cruise businesses (approx. 60% of passengers) and an extrapolation of the remaining 40%. The estimate includes Scope 1 & 2 emissions, given that most cruise businesses do not disclose their Scope 3 emissions. Aviation carbon emissions, which represent around 17% of total Travel & Tourism emissions, are documented and reported regularly by industry bodies, such as the International Air Transport Association (IATA), whose pre-pandemic estimates amounted to 915 million tCO2, excluding mainly Scope 324.
For Tour Operators, OTAs and the other intermediaries included in the analysis, valid estimates and reporting information are currently unavailable due to the fragmentation of these industries. An initial intent to estimate carbon emissions specifically for OTAs was undertaken in the context of this report by consolidating the carbon emissions reported by the top three OTAs with the highest market share (approximately 86%) and an extrapolation of the remainder 14%. The result is a carbon footprint lower than 1 million tCO2 emissions, however given that two of three OTAs did not disclose their scope 3 in 2019, the latter estimate includes mainly scope 1 and 2 emissions.
Carbon Intensities
Climate change mitigation is measured in terms of the total amount of CO2 that can be emitted before global temperatures increase beyond the +2 degrees Celsius agreed on in the Paris Agreement. Although global goals, such as the sector’s 2050 net zero goal, refer to the reduction in absolute emissions (emission reduction targets), most of the focus industries track their carbon emission reductions in terms of carbon intensity gains (carbon efficiency targets). In this context, carbon intensity can be defined as the volume of emissions relative to a specific unit of economic activity/metric that reflects the primary operation of a given industry. This allows businesses to set emissions reduction targets while accounting for growth. In some cases, however, the growth of a particular industry might translate into a decrease of its carbon intensity and at the same time an increase in absolute emissions. While the aviation industry usually expresses carbon intensity in grammes of CO2 per revenue passenger kilometre (RPK) or per available seat kilometre (ASK), most cruise companies report their carbon intensity in grammes of CO2 per available lower berth (ALB) kilometre. In accommodation, an initiative is currently under way to develop a Net Zero Hotel Methodology25 with the goal to streamline and align carbon intensity reporting in kilogrammes of CO2 per square meter and includes a suggested metric in CO2 emissions per occupied room per night. Regarding the other industries, some tour operators (asset light), OTAs and TAs report their carbon intensity as tonnes of CO2 per full-time equivalent (FTE) or per revenue generated. However, the latter is not standardised or commonly used yet.
Carbon intensity ranges vary significantly depending on the industry (see exhibit 5). For instance, carbon intensities per passenger basis might seem lower for long and short-haul flights vis-à-vis carbon intensity ranges for cruise passenger kilometres. However, when applying these intensities to specific travel examples the picture looks different. Although shorter flights tend to have lower carbon intensity ranges per passenger km than flights with longer distances due to increased fuel burned in take-off and landing, a long-haul flight in an economy cabin produces similar total emissions to a 6-day cruise, and much higher total emissions than a short-haul flight in an economy cabin. This highlights the importance of differentiated views and the need to closely monitor and consider both intensities and absolute emissions for mittigation pathways.
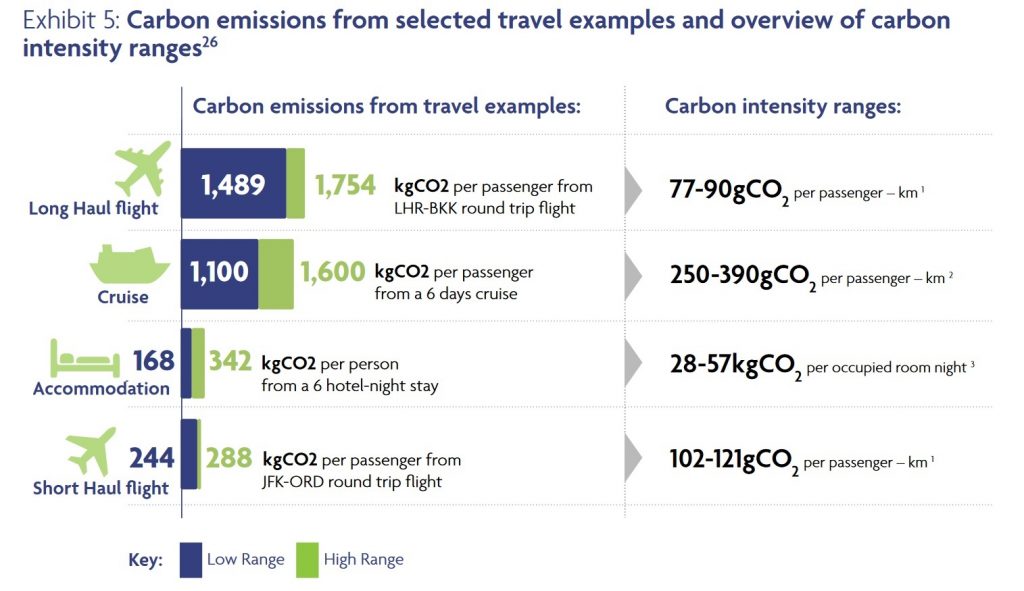
Note: (1) Carbon intensity for economy cabin seats, (2) Average emissions intensity of the world’s largest cruise operator (low range) and emission intensity of the cruise ship class with the second highest intensity measure (3) Averages of Measure 1 lower and upper quartile from Cornell Hotel Sustainability Benchmarking Index (CHSB) 2021 (4) While cruise is often considered as a transport-only industry, it provides accommodation and transportation services.
Industry Emission Profiles
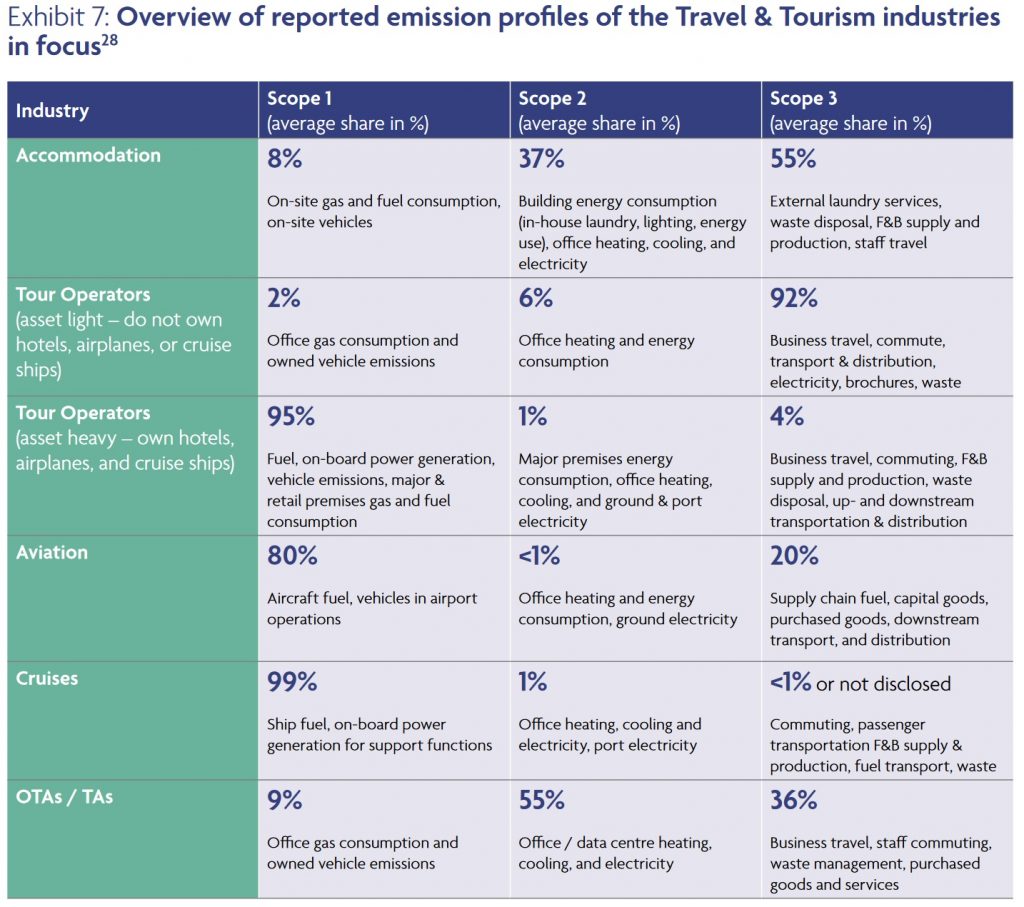
Overall, results reveal that the distribution of Scope 1, 2, and 3 emissions tends to vary significantly between the focus
industries, indicating that businesses face different levels of complexities when it comes to reducing emissions.
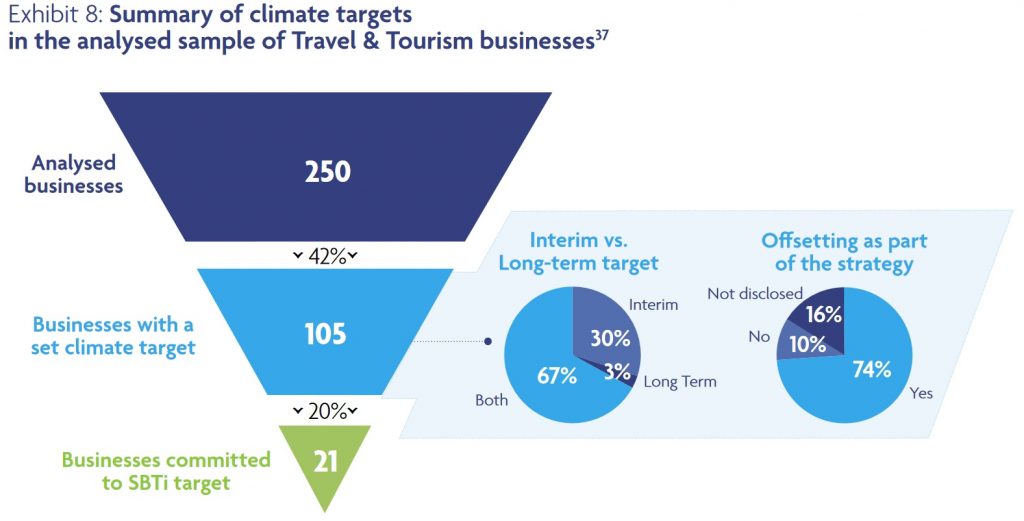
Climate Targets
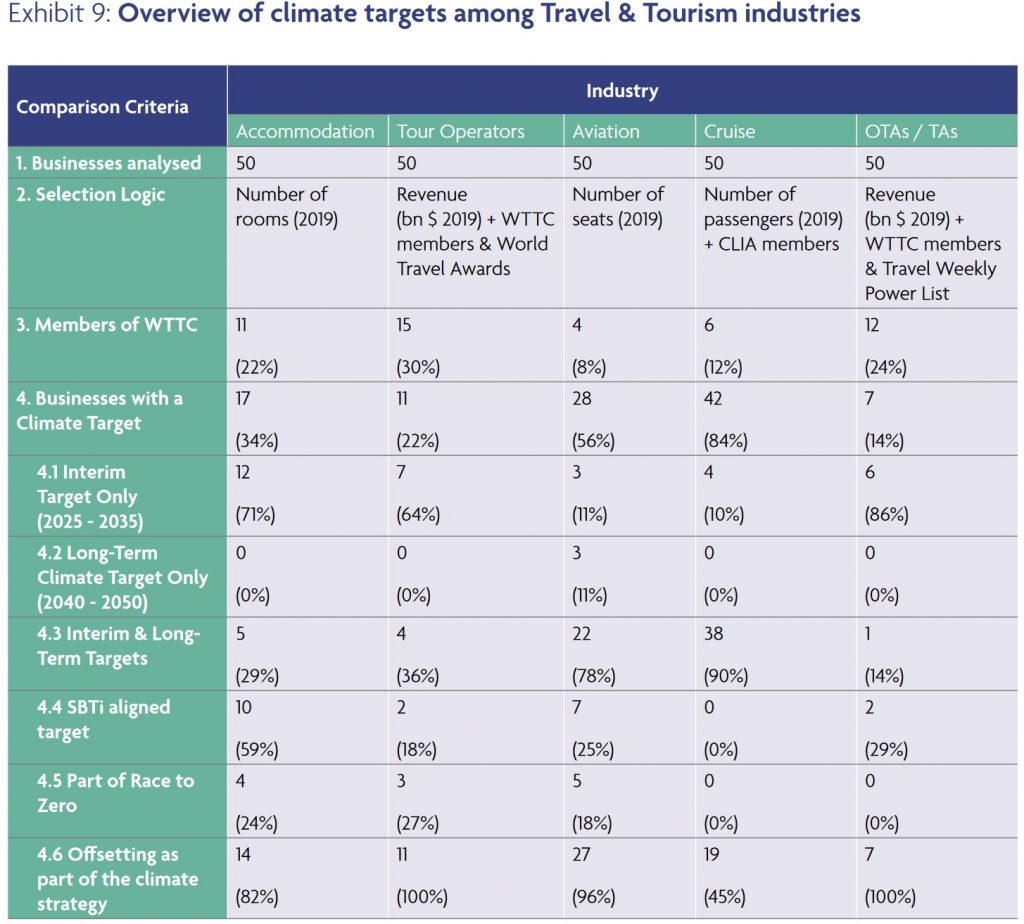
Source: World Travel & Tourism Council (WTTC), November